Analytics & reach
Profile Analytics
Views, clicks, unique visitors, conversion rate and how to read them honestly.
Open Account → Analytics. The dashboard auto-refreshes every 15 seconds while the tab is open, and a Live now badge shows visitors active in the last 5 minutes.
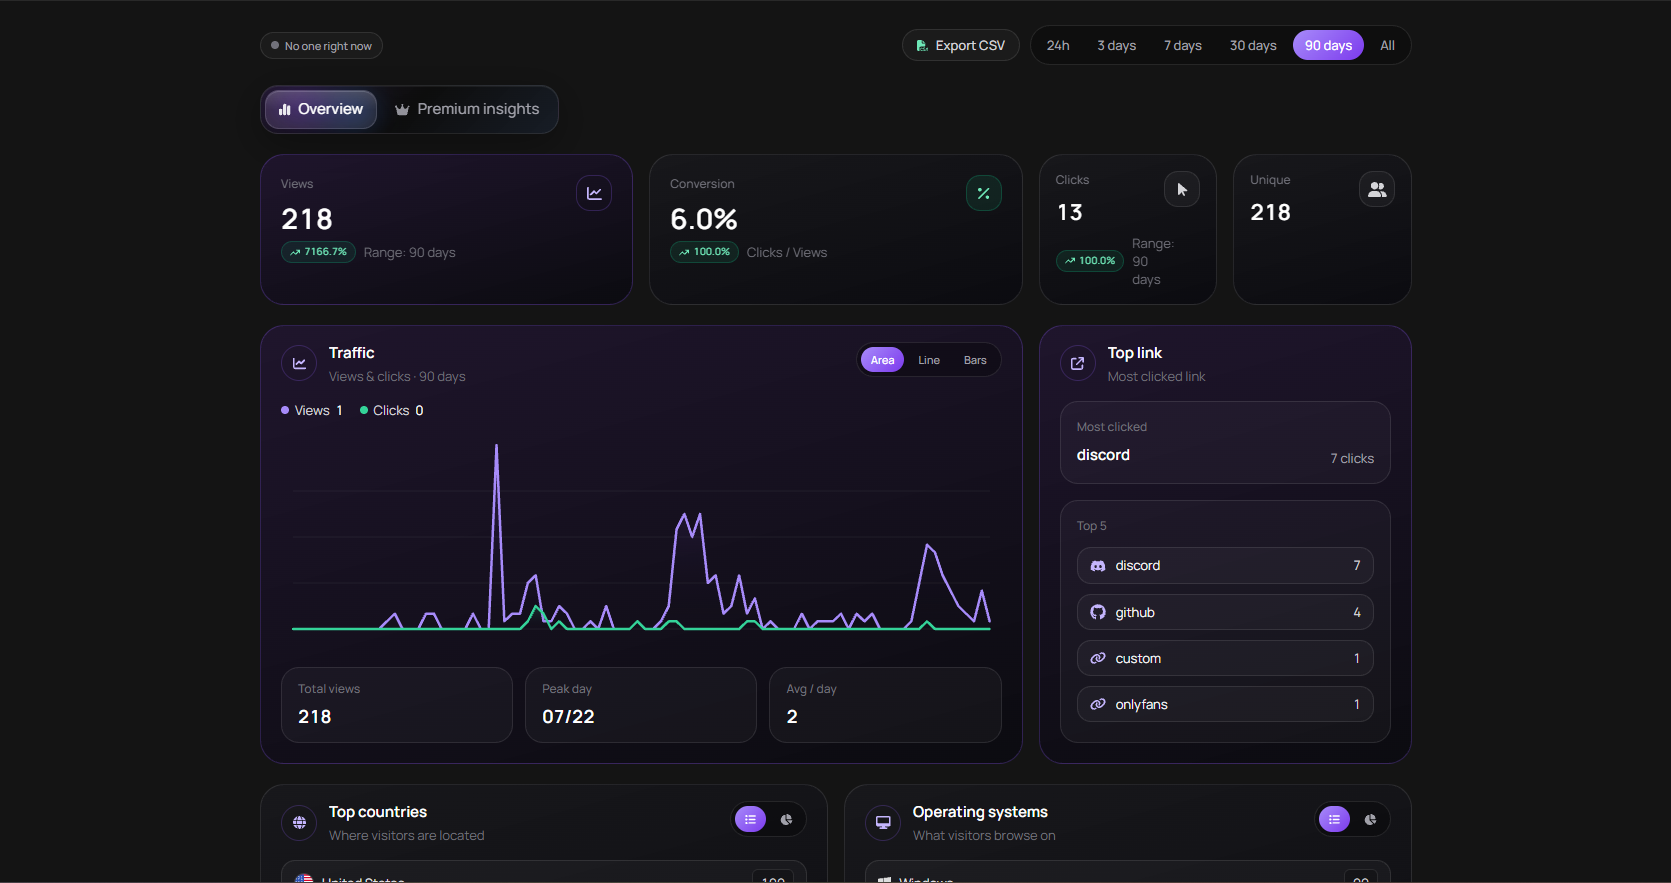
The four core metrics
- Views — how many times your page was opened.
- Clicks — how many link taps you got.
- Unique visitors — estimated distinct people.
- Conversion rate — clicks divided by views.
Quick example
1,000 views and 250 clicks is a 25% conversion rate.
The view counter on your card
The small counter on your card shows total profile views, and it is the same number the dashboard builds on.
- One page open by a visitor counts as a view, from any source — direct, social or search, on your thugg.lol URL or a custom domain.
- Obvious automation, rapid self-refreshes and artificial boosting are filtered out so the number stays worth something.
- Public pages are cached for a few minutes, so the card can sit a moment behind the dashboard — analytics is the source of truth.
Time ranges
- Free — last 24 hours, 3 days and 7 days.
- Premium — 30 days, 90 days and All-time.
- KPI cards compare against the previous period of the same length.
Where your traffic comes from
- Countries — from a rough network-level location signal.
- Devices and OS — from the visitor's device information.
- Sources — the referring platform, such as Instagram, TikTok, Discord or direct.
Views but no clicks
Normal, and not always bad.
- They found what they needed in your bio.
- They only wanted to confirm you are real.
- They opened it by accident.
- They meant to come back later — common on mobile.
Why our numbers differ from social platforms
- Social apps may count link opens that never fully load.
- Platforms group visitors differently across devices and in-app browsers.
- We filter obvious automation and self-testing.
The goal is consistency inside thugg.lol, so your decisions rest on the same yardstick every week.
This did not solve it?
Open a ticket with Profile Analytics already attached, or ask in Discord where someone is usually awake.